
Scope 3 represents the vast majority of Food & Beverage emissions and is now critical for access to capital, regulatory compliance, and operational resilience. Requiring a shift from legacy estimation methods to dynamic, per-product carbon footprints (PCFs) embedded directly into business decision-making systems.
What is scope 3 & the scale
For the Food & Beverage sector, Scope 3 is not just a reporting line it is the vast majority of your climate impact.
The "Lion's Share": For grocery retailers, upstream purchased goods and services can account for upwards of 95% of the total corporate carbon footprint.
Sector Reality: While manufacturers may have slightly higher operational (Scope 1 & 2) emissions, the overwhelming majority of emissions for F&B companies of all sizes lie outside their direct control in the value chain, in their scope 3.
Why You Must Act
Access to Green Capital (Liquidity Risk):
The finance system was one of the first to recognise its own levers for both meeting its own decarbonisation targets and to reduce portfolio risk.
Cheaper Money: The best financial rates globally are now attached to "Green" instruments (e.g., Sustainability-Linked Loans) tied to ESG outcomes.
The "Financed Emissions" Trap: Your Scope 3 is your bank’s "financed emissions" (Category 15). Major global banks have set interim 2030 targets for high-emitting sectors; to hit their targets, they must pressure you to lower yours.
Capital Flight: Without credible Scope 3 data, companies risk higher borrowing costs and restricted access to debt markets as financiers decarbonise their own balance sheets.
Rising Regulation (Mandatory Reporting):
Scope 3 reporting mandates may have slowed but they aren’t going away. The system has irrevocably incorporated them into business.
EU CSRD (Corporate Sustainability Reporting Directive): Moves reporting from voluntary to mandatory, requiring granular Scope 3 disclosure for EU companies and non-EU firms with significant presence there.
California SB 253 (Climate Corporate Data Accountability Act): Requires public and private US companies doing business in California (with >$1B revenue) to report full Scope 3 emissions starting in 2027.
Global Standards: The ISSB (IFRS S2) now mandates Scope 3 disclosure as a global baseline for capital markets.
Value Chain Intelligence (Operational Resilience):
The hidden gold in scope 3 accounting. Opening the door on your value chain for commercial wins.
Manage, Don't Just Measure: Calculating Scope 3 transforms an opaque supply chain into a transparent intelligence network, exposing hidden risks and dependencies.
Resilience & Revenue: Granular visibility allows for strategic sourcing and product innovation, protecting revenue and building resilience against climate volatility and carbon pricing.
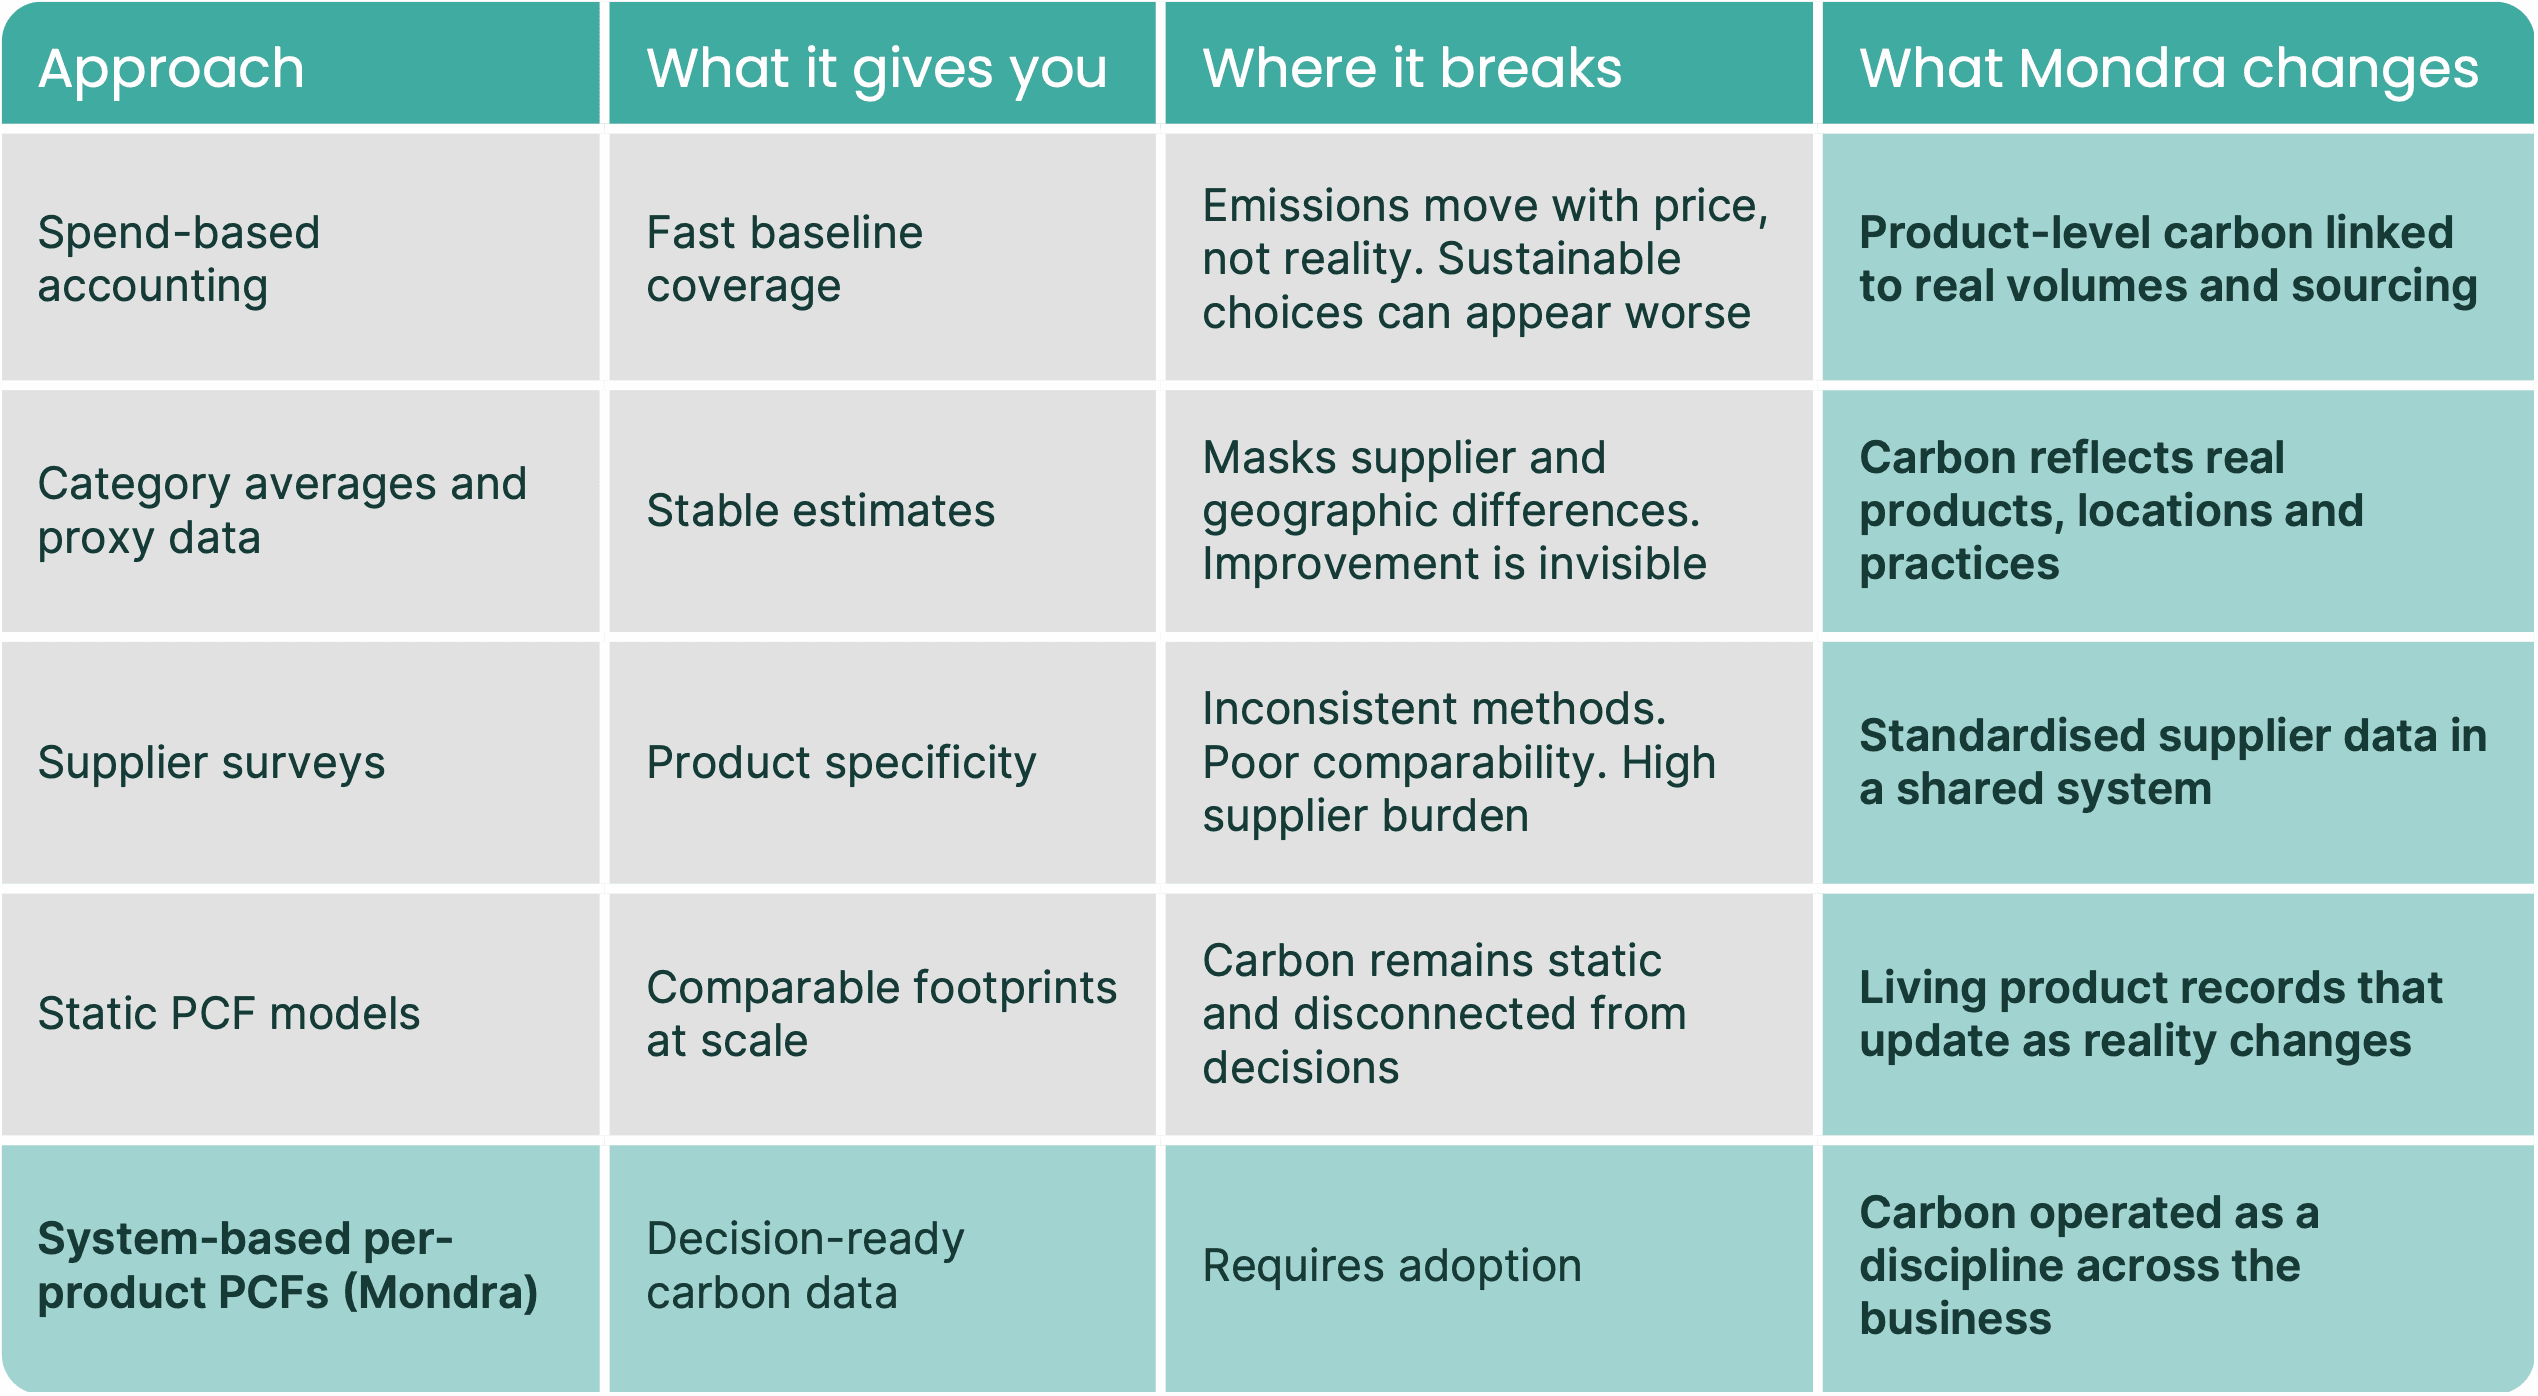
The Flawed Legacy Approaches: Why a Pivot to Per-Product PCFs is Mandatory
To achieve the data granularity required for genuine decarbonisation decision making organisations must move beyond the "legacy" estimation methods. While these methods provided an initial entry point for reporting, they are structurally incapable of reflecting specific supply chain realities or informing commercial decisions.
Spend-Based Accounting (The "Financial" Trap)
What it is:
This method estimates emissions by taking the monetary value of purchased goods (e.g., "€5 million on cheese") and multiplying it by "Environmentally Extended Input-Output" (EEIO) emission factors. It relies entirely on financial spend as a proxy for environmental impact.
The Pros (Why it was used):
Accessibility: It is the fastest way to calculate a baseline because it utilizes financial data already available in ERP systems, requiring no engagement with suppliers.
Hotspot Identification: It provides 100% coverage of the supply chain, making it a useful screening tool to identify high-impact categories before deeper analysis.
The Flaws & Limitations (Why it fails):
The Green Premium Paradox: This is the critical fatal flaw. Sustainable materials often cost more than conventional ones. Under a spend-based model, purchasing a "greener" but more expensive product paradoxically increases a company's reported carbon footprint. This penalizes procurement teams for making sustainable choices.
Economic Volatility: Reported emissions fluctuate with inflation and market prices rather than physical reality. If the price of raw materials rises by 15%, reported emissions rise by 15%, even if the carbon intensity remains flat.
Zero Actionability: The only lever available to reduce reported emissions under this model is to spend less. It cannot reflect improvements in production efficiency or supplier renewable energy use.
Category Proxying / Average-Data Method (The "Generic" Trap)
What it is:
This approach moves away from spend to physical units (e.g., kilograms or litres) but applies a generic secondary emission factor (sourced from public life cycle assessment databases) to represent broad product categories.
Example: Applying a single global average "Bread" factor to all bakery purchases, regardless of whether the wheat in the bread was grown using regenerative agriculture in the UK or conventional methods in a water-stressed region.
The Pros (Why it was used):
Stability: It decouples emissions from price volatility and inflation, offering a more stable baseline than spend-based accounting.
Differentiation Potential: It allows for basic distinction between product types (e.g., pizzas vs pies) which spend-based methods might conflate if costs are similar.
The Flaws & Limitations (Why it fails):
Geographic & Technological Homogenisation: Industry averages mask significant variability. A product manufactured with renewable energy in Scandinavia is treated identically to one made with coal power in Asia if the same "average" factor is used.
Blocks Supply Chain Innovation: This method creates a "ceiling" on accuracy. If a supplier invests in decarbonisation (e.g., installing solar panels), the retailer cannot capture that benefit in their reporting because they are using a static industry average.
Lack of Fidelity: It fails to distinguish between high-performance and low-performance products within the same category (e.g., a vegan dhal vs. a beef madras might both be proxied simply as "Ready Meal").
The Pivot: Why "Per-Product PCFs" Are the Only Viable Goal
The limitations above demonstrate that legacy methods are estimation tools, not management tools. To transition from "accounting for carbon" to "operating with carbon," organisations must pivot to Per-Product PCFs (Supplier-Specific Data):
Procurement Lever: PCFs enable companies to "Buy Smart" by identifying the carbon intensity of individual products (SKUs), allowing them to select lower-carbon suppliers without reducing commercial volume.
Green Capital Link: They provide the 'investment-grade,' audit-ready data required by regulators (e.g., CSRD, SEC) and financial institutions to access lower costs of capital.
Dynamic Operations: PCFs transform carbon from a static report into a dynamic metric, creating "living product records" that reflect real-time changes in the supply chain and manage transition risk.
The available options for per-product PCFs - the 4-tiers
Emission Factor Databases (The "Generic" Approach)
Assign each product a PCF from a library of pre-calculated emission factors (such as Agribalyse). Not specific to your products or value chain.
Pros: Fast and low cost to implement. Meets reporting needs. Gives shape to your assortment carbon.
Cons: The data is not specific to your actual products. Just as you wouldn't build your sandwich category plan using another retailer's sandwich data, you cannot effectively manage carbon using a "proxy" sandwich to represent your own. Static data reduces measurable actions (e.g. reformulation).
What to look for: Consistent library based on a single standard methodology to ensure product comparability between and within categories. EF’s representative of your market / country. Automatic classification of products for full coverage fast.
How Mondra can help you: The largest collection of verified, internally consistent, GHG Protocol compliant emissions factors available for food and beverage products. Global and national-level (a growing library) variants ensure representation of your market, updated annually. Available as Data as a Service (DaaS) or Software as a Service (SaaS) on our Comply tier. AI product classification saves time. Exportable Scope 3 and SBTi FLAG reports.
Supplier-Generated PCFs (The "Survey" Approach)
Ask your suppliers to individually calculate and upload a PCF for the products they sell. Option to override static emission factors database PCFs. Works well with the WBCSD PACT framework.
Pros: Engages your suppliers in achieving your shared targets, shared effort. PCFs are specific to your products. Each supplier can work towards own individual reduction targets.
Cons: Complex ask and expense for suppliers. Delivers incomparable results; use of different tools, methods, or standards will report different numbers, blocking inter-supplier decision making.
What to look for: Facility to compare supplier data against a standardized methodology baseline PCF. Captures data quality attributes to score submissions against a rigorous, non-subjective framework and ensure compliance to GHG Protocol requirements.
How Mondra can help you: Freely available on Mondra’s Collaborate SaaS tier and above. Supplier invite, data capture, automatic data quality assessment, load and ready to report.
Scaled Self-Generated PCFs (The "Model" Approach)
Utilise your pre-existing product-specific data to calculate PCF for every product automatically.
Pros: Delivers absolute comparability across all SKU PCFs, same standard delivers comparable numbers. Faster and cheaper than surveying suppliers. Increases the value of pre-existing data, supports business case for adoption.
Cons: Often semi-static modelling reducing ability to integrate to dynamic business processes.
What to look for: Capability to work with varying levels of input data including ingredient lists, Bill of Materials or better. Ability to utilise all your data in the PCF, ensuring single version of truth. Quantifies and transparently reports data quality of the PCF to inform decision making. Ability to integrate primary data (e.g. farm, site energy) to refine PCFs. High clarity product value chain modelling to maximise automatic identification of potential carbon reductions. Requires per-product volume data to enable development of reduction strategies that recognise priority.
How Mondra can help you: Mondra’s Hypermodelling technology automatically generates Product Carbon Footprints (PCFs) using a full life-cycle assessment (LCA) approach, calculating the carbon, water, pollution and biodiversity of every conversion event across the supply chain. Thousands of product-specific PCFs can be generated in hours, fully aligned with GHG Protocol, GSTA guidance, and Carbon Trust assurance (coming Q1 ’26). Integrates product volume data for complete Food & Beverage Scope 3 accounting. Out-of-the-box API integrations to the most popular PLM and PIM solution vendors.
Scaled Self-Generate PCF Systems (The "Mondra" Approach)
PCF data is refreshed fully dynamically and connected to business processes. Replaces static footprinting with "living product records" integrated directly into your organisations system of record (including PLM / Compliance / ERP / BI). Full collaborative supplier experience, shared data for fast decision making and action. A framework to expand your business data dimensions over sustainability, commercial, nutrition, risk and resilience.
Pros: Accelerates carbon reduction progress by "operationalising" carbon data across all business functions, in particular with commercial teams. Living product records enable seamless insight and decision making from value chain to product. A value chain system of record for your business, additional value activated by layering on additional data dimensions.
Cons: Requires business transformation.
What to look for: Direct API integrations with product systems of record are mandatory, similarly outbound API connections available for your IT enterprise to consume. Supply chain digital twins that can represent your full value chain at the company level. Full collaborative interface for suppliers to refine data and take ownership of their node in the chain. Business process supporting capabilities that enable category planning, product development and sourcing strategy development, decision making and action. AI multi-dimensional insight and decision support.
How Mondra can help you: On Mondra’s Collaborate and Compete tiers we deliver fully dynamic PCF modelling through API connectivity to your system of record, enabling real-time business decision making that delivers carbon reduction inline with existing commercial outcomes. Capabilities to enable sustainability and procurement to commercial and strategy - supporting a shift from regulatory compliance to durable competitive advantage. Full collaborative SaaS experience for every supplier, including refinement and product development features. Digital Supply Chain Twins for every product, creating a new system of record for your value chain, ready to receive and store any dimension of data including risk and resilience. A full suite of professional services that deliver the operational change required to transform your organisation to maximise it’s commercial advantage.
Discover how leading food brands use Mondra
Learn how Mondra helps food and beverage companies cut Scope 3 emissions and strengthen supply chain resilience.
Book a demo
Book a demo


